Clickstream Data Analysis Pipeline Using ksqlDB (Docker)
These steps will guide you through how to setup your environment and run the clickstream analysis tutorial from a Docker container.
Prerequisites:
- Docker:
- Docker version 1.11 or later is installed and running.
- Docker Compose is installed. Docker Compose is installed by default with Docker for Mac.
- Docker memory is allocated minimally at 8 GB. When using Docker Desktop for Mac, the default Docker memory allocation is 2 GB. You can change the default allocation to 8 GB in Docker > Preferences > Advanced.
- Git.
- Internet connectivity.
- Ensure you are on an Operating System currently supported by Confluent Platform.
- wget to get the connector configuration file.
- If you are using Linux as your host, for the Elasticsearch container
to start successfully you must first run:
bash
    sudo sysctl -w vm.max_map_count=262144
Download and run the tutorial
The tutorial is built using Docker Compose. It brings together several Docker images with the required networking and dependencies. The images are quite large and depending on your network connection may take 10-15 minutes to download.
1. Clone the repo
Clone the Confluent examples repository.
git clone https://github.com/confluentinc/examples.git
cd examples
2. Check out the release branch
Switch to the correct Confluent Platform release branch:
git checkout 5.4.1-post
3. Launch the tutorial in Docker
Navigate to the correct directory and start the tutorial in Docker. Depending on your network speed, this may take up to 5-10 minutes.
cd clickstream
docker-compose up -d
4. Check the status
After a minute or so, run the docker-compose ps status command to ensure
that everything has started correctly:
docker-compose ps
Your output should resemble:
    Name                    Command               State                Ports
-------------------------------------------------------------------------------------------
datagen           bash -c echo Waiting for K ...   Up
elasticsearch     /usr/local/bin/docker-entr ...   Up      0.0.0.0:9200->9200/tcp, 9300/tcp
grafana           /run.sh                          Up      0.0.0.0:3000->3000/tcp
kafka             /etc/confluent/docker/run        Up      9092/tcp
kafka-connect     /etc/confluent/docker/run        Up      0.0.0.0:8083->8083/tcp, 9092/tcp
kafkacat          /bin/sh                          Up
ksql-cli          /bin/sh                          Up
ksql-server       /etc/confluent/docker/run        Up      0.0.0.0:8088->8088/tcp
schema-registry   /etc/confluent/docker/run        Up      8081/tcp
zookeeper         /etc/confluent/docker/run        Up      2181/tcp, 2888/tcp, 3888/tcp
Create the Clickstream Data
A data generator is already running, simulating the stream of clicks.
You can sample this stream by using a console consumer such as
kafkacat:
docker-compose exec kafkacat \
        kafkacat -b kafka:29092 -C -c 10 -K: \
        -f '\nKey  : %k\t\nValue: %s\n' \
        -t clickstream
Note
If you get the message "Broker: Leader not available", try again after a moment, as the demo is still starting up.*
The kafkacat command stops after ten messages, and your output should
resemble:
Key  : 111.90.225.227
Value: {"ip":"111.90.225.227","userid":36,"remote_user":"-","time":"11/Sep/2018:09:53:04 +0000","_time":1536659584702,"request":"GET /images/track.png HTTP/1.1","status":"302","bytes":"2048","referrer":"-","agent":"Mozilla/5.0 (Windows NT 10.0; Win64; x64) AppleWebKit/537.36 (KHTML, like Gecko) Chrome/59.0.3071.115 Safari/537.36"}

Key  : 233.173.215.103
Value: {"ip":"233.173.215.103","userid":15,"remote_user":"-","time":"11/Sep/2018:09:53:05 +0000","_time":1536659585434,"request":"GET /index.html HTTP/1.1","status":"406","bytes":"278","referrer":"-","agent":"Mozilla/5.0 (compatible; Googlebot/2.1; +http://www.google.com/bot.html)"}
[...]
If you remove the -c 10 argument from the previous command you can run
kafkacat to see a complete stream of all messages on the topic. If you do
run this, press Ctrl+C to cancel it and return to the command prompt.
There are two other sets of data in Kafka topics that have been automatically populated. They hold information about the HTTP status codes, and users.
1. View the status codes data
docker-compose exec kafkacat \
    kafkacat -b kafka:29092 -C -c 3 -K: \
    -f '\nKey  : %k\tValue: %s' \
    -t clickstream_codes
Your output should resemble:
Key  : 405      Value: {"code":405,"definition":"Method not allowed"}
Key  : 407      Value: {"code":407,"definition":"Proxy authentication required"}
Key  : 302      Value: {"code":302,"definition":"Redirect"}
...
2. View the user data
docker-compose exec kafkacat \
    kafkacat -b kafka:29092 -C -c 3 -K: \
        -f '\nKey  : %k\tValue: %s' \
        -t clickstream_users
Your output should resemble:
Key  : 1        Value: {"user_id":1,"username":"DimitriSchenz88","registered_at":1432700187062,"first_name":"Arlyne","last_name":"Garrity","city":"Frankfurt","level":"Gold"}
Key  : 2        Value: {"user_id":2,"username":"AbdelKable_86","registered_at":1454795231290,"first_name":"Reeva","last_name":"Pask","city":"San Francisco","level":"Silver"}
Key  : 3        Value: {"user_id":3,"username":"Antonio_0966","registered_at":1464740725409,"first_name":"Woodrow","last_name":"Vanyard","city":"Frankfurt","level":"Platinum"}
...
Load the Streaming Data to KSQL
1. Launch the KSQL CLI:
docker-compose exec ksql-cli ksql http://ksql-server:8088
You should now be in the KSQL CLI.
                ===========================================
                =       _              _ ____  ____       =
                =      | | _____  __ _| |  _ \| __ )      =
                =      | |/ / __|/ _` | | | | |  _ \      =
                =      |   <\__ \ (_| | | |_| | |_) |     =
                =      |_|\_\___/\__, |_|____/|____/      =
                =                   |_|                   =
                =  Event Streaming Database purpose-built =
                =        for stream processing apps       =
                ===========================================

Copyright 2017-2019 Confluent Inc.

CLI v0.8.0, Server v0.8.0 located at http://ksql-server:8088

Having trouble? Type 'help' (case-insensitive) for a rundown of how things work!

ksql>
2. Load the SQL file that defines the app
Load the clickstream-schema.sql file that runs the tutorial app.
Important
Before running this step, you must have already run ksql-datagen
utility to create the clickstream data, status codes, and set of users.
RUN SCRIPT '/usr/share/doc/clickstream/clickstream-schema.sql';
The output will show either a blank message, or
Executing statement, similar to this:
 Message
---------
 Executing statement
---------
Verify the data
Verify that the data was loaded properly.
Note
The following steps are optional and can be used to verify that the data was loaded properly. Otherwise, you can skip to Load and View the Clickstream Data in Grafana.
1. Verify that the tables are created.
LIST TABLES;
Your output should resemble:
 Table Name                 | Kafka Topic                | Format | Windowed
-----------------------------------------------------------------------------
 WEB_USERS                  | clickstream_users          | JSON   | false
 ERRORS_PER_MIN_ALERT       | ERRORS_PER_MIN_ALERT       | JSON   | true
 USER_IP_ACTIVITY           | USER_IP_ACTIVITY           | JSON   | true
 CLICKSTREAM_CODES          | clickstream_codes          | JSON   | false
 PAGES_PER_MIN              | PAGES_PER_MIN              | JSON   | true
 CLICK_USER_SESSIONS        | CLICK_USER_SESSIONS        | JSON   | true
 ENRICHED_ERROR_CODES_COUNT | ENRICHED_ERROR_CODES_COUNT | JSON   | true
 ERRORS_PER_MIN             | ERRORS_PER_MIN             | JSON   | true
 EVENTS_PER_MIN             | EVENTS_PER_MIN             | JSON   | true
2. Verify that the streams are created.
LIST STREAMS;
Your output should resemble:
 Stream Name               | Kafka Topic               | Format
----------------------------------------------------------------
 USER_CLICKSTREAM          | USER_CLICKSTREAM          | JSON
 ENRICHED_ERROR_CODES      | ENRICHED_ERROR_CODES      | JSON
 CLICKSTREAM               | clickstream               | JSON
3. Verify the event streams
Verify that events are streaming through various tables and streams.
View clickstream data
SELECT * FROM CLICKSTREAM EMIT CHANGES LIMIT 5;
Your output should resemble:
1536662784214 | 111.168.57.122 | 1536662783614 | 11/Sep/2018:10:46:23 +0000 | 111.168.57.122 | GET /images/logo-small.png HTTP/1.1 | 200 | 35 | 1289 | Mozilla/5.0 (Windows NT 10.0; Win64; x64) AppleWebKit/537.36 (KHTML, like Gecko) Chrome/59.0.3071.115 Safari/537.36
1536662784261 | 222.245.174.248 | 1536662784260 | 11/Sep/2018:10:46:24 +0000 | 222.245.174.248 | GET /index.html HTTP/1.1 | 404 | 7 | 14096 | Mozilla/5.0 (compatible; Googlebot/2.1; +http://www.google.com/bot.html)
1536662784335 | 111.90.225.227 | 1536662784335 | 11/Sep/2018:10:46:24 +0000 | 111.90.225.227 | GET /site/login.html HTTP/1.1 | 302 | 36 | 4096 | Mozilla/5.0 (Windows NT 10.0; Win64; x64) AppleWebKit/537.36 (KHTML, like Gecko) Chrome/59.0.3071.115 Safari/537.36
1536662784351 | 233.245.174.248 | 1536662784351 | 11/Sep/2018:10:46:24 +0000 | 233.245.174.248 | GET /site/user_status.html HTTP/1.1 | 405 | 15 | 2048 | Mozilla/5.0 (Windows NT 10.0; Win64; x64) AppleWebKit/537.36 (KHTML, like Gecko) Chrome/59.0.3071.115 Safari/537.36
1536662784421 | 222.168.57.122 | 1536662784421 | 11/Sep/2018:10:46:24 +0000 | 222.168.57.122 | GET /images/logo-small.png HTTP/1.1 | 302 | 28 | 14096 | Mozilla/5.0 (Windows NT 10.0; Win64; x64) AppleWebKit/537.36 (KHTML, like Gecko) Chrome/59.0.3071.115 Safari/537.36
Limit Reached
Query terminated
ksql>
View the events per minute
SELECT * FROM EVENTS_PER_MIN EMIT CHANGES LIMIT 5;
Your output should resemble:
1536662819576 | 1536662760000 | 1536662765000 | 24 | 24 | 12
1536662819685 | 1536662760000 | 1536662765000 | 4  | 4 | 19
1536662847582 | 1536662820000 | 1536662825000 | 4  | 4 | 75
1536662847586 | 1536662820000 | 1536662825000 | 24 | 24 | 101
1536662879959 | 1536662820000 | 1536662825000 | 29 | 29 | 2
Limit Reached
Query terminated
View pages per minute
SELECT * FROM PAGES_PER_MIN EMIT CHANGES LIMIT 5;
Your output should resemble:
1536662784977 | 1536662725000 | 1536662730000 | 21 | 21 | 2
1536662789353 | 1536662730000 | 1536662735000 | 21 | 21 | 7
1536662793715 | 1536662735000 | 1536662740000 | 21 | 21 | 20
1536662799627 | 1536662740000 | 1536662745000 | 21 | 21 | 35
1536662804534 | 1536662745000 | 1536662750000 | 21 | 21 | 40
Limit Reached
Query terminated
Load and View the Clickstream Data in Grafana
Send the KSQL tables to Elasticsearch and Grafana.
1. Exit the ksqlDB CLI
Exit the ksqlDB CLI by using Ctrl+D.
ksql>
Exiting ksqlDB.
2. Start Elasticsearch
Set up the required Elasticsearch document mapping template
docker-compose exec elasticsearch bash -c '/scripts/elastic-dynamic-template.sh'
3. Connect to Elasticsearch and Grafana
Run the following command to send the ksqlDB tables to Elasticsearch and Grafana:
docker-compose exec kafka-connect bash -c '/scripts/ksql-tables-to-grafana.sh'
Your output should resemble:
Loading Clickstream-Demo TABLES to Confluent-Connect => Elastic => Grafana datasource


==================================================================
Charting  CLICK_USER_SESSIONS
        -> Remove any existing Elastic search config
        -> Remove any existing Connect config
        -> Remove any existing Grafana config
        -> Connecting KSQL->Elastic->Grafana  click_user_sessions
        -> Connecting: click_user_sessions
                -> Adding Kafka Connect Elastic Source es_sink_CLICK_USER_SESSIONS
                ->Adding Grafana Source

[...]
4. Load the dashboard into Grafana
docker-compose exec grafana bash -c '/scripts/clickstream-analysis-dashboard.sh'
Your output should resemble:
Loading Grafana ClickStream Dashboard
{"id":1,"slug":"click-stream-analysis","status":"success","uid":"lUHTGDTmz","url":"/d/lUHTGDTmz/click-stream-analysis","version":4}

Navigate to:
        http://localhost:3000/d/lUHTGDTmz/click-stream-analysis
(Default user: admin / password: admin)
5. Open the Grafana UI
Open your your browser using the URL output from the previous
step's command. You can login with user ID admin and password
admin.
Important
If you already have Grafana UI open, you may need to enter the specific clickstream URL output by the previous step.
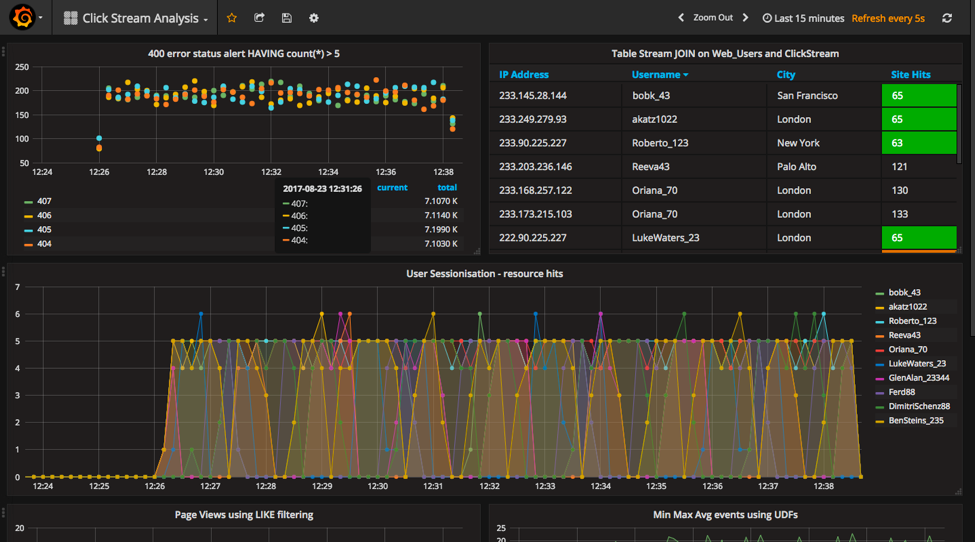
This dashboard demonstrates a series of streaming functionality where
the title of each panel describes the type of stream processing required
to generate the data. For example, the large chart in the middle is
showing web-resource requests on a per-username basis using a Session
window - where a sessions expire after 300 seconds of inactivity.
Editing the panel allows you to view the datasource - which is named
after the streams and tables captured in the clickstream-schema.sql
file.
Things to try:
- Understand how the
clickstream-schema.sqlfile is structured. We use a DataGen.KafkaTopic.clickstream -> Stream -> Table (for window & analytics with group-by) -> ElasticSearch/Connect topic - Run the KSQL CLI
LIST TOPICS;command to see where data is persisted - Run the KSQL CLI
historycommand
Troubleshooting
- Check the Data Sources page in Grafana.
- If your data source is shown, select it and scroll to the bottom and click the Save & Test button. This will indicate whether your data source is valid.